
Blockscout Stats: Analyze Data from your Favourite Chains
The blockchain ecosystem relies on transparency and real-time access to data, which allows builders, data analysts, and researchers to interpret information from blockchain networks. Blockscout is at the forefront of this movement, providing users with an interface to view and analyze blockchain data effectively.
Blockscout stats (statistics) offer comprehensive access to a range of detailed blockchain data, including key metrics on accounts, transactions, and contracts. Users can explore and analyze this data through various filtering options, enabling them to narrow their focus based on specific criteria such as time frames and types of data.
This capability fosters more informed decision-making and a deeper understanding of blockchain activities. Additionally, Blockscout provides visual representations of the data, making it easier to interpret Trends and patterns within the specific blockchain.
Start Exploring Blockscout Stats
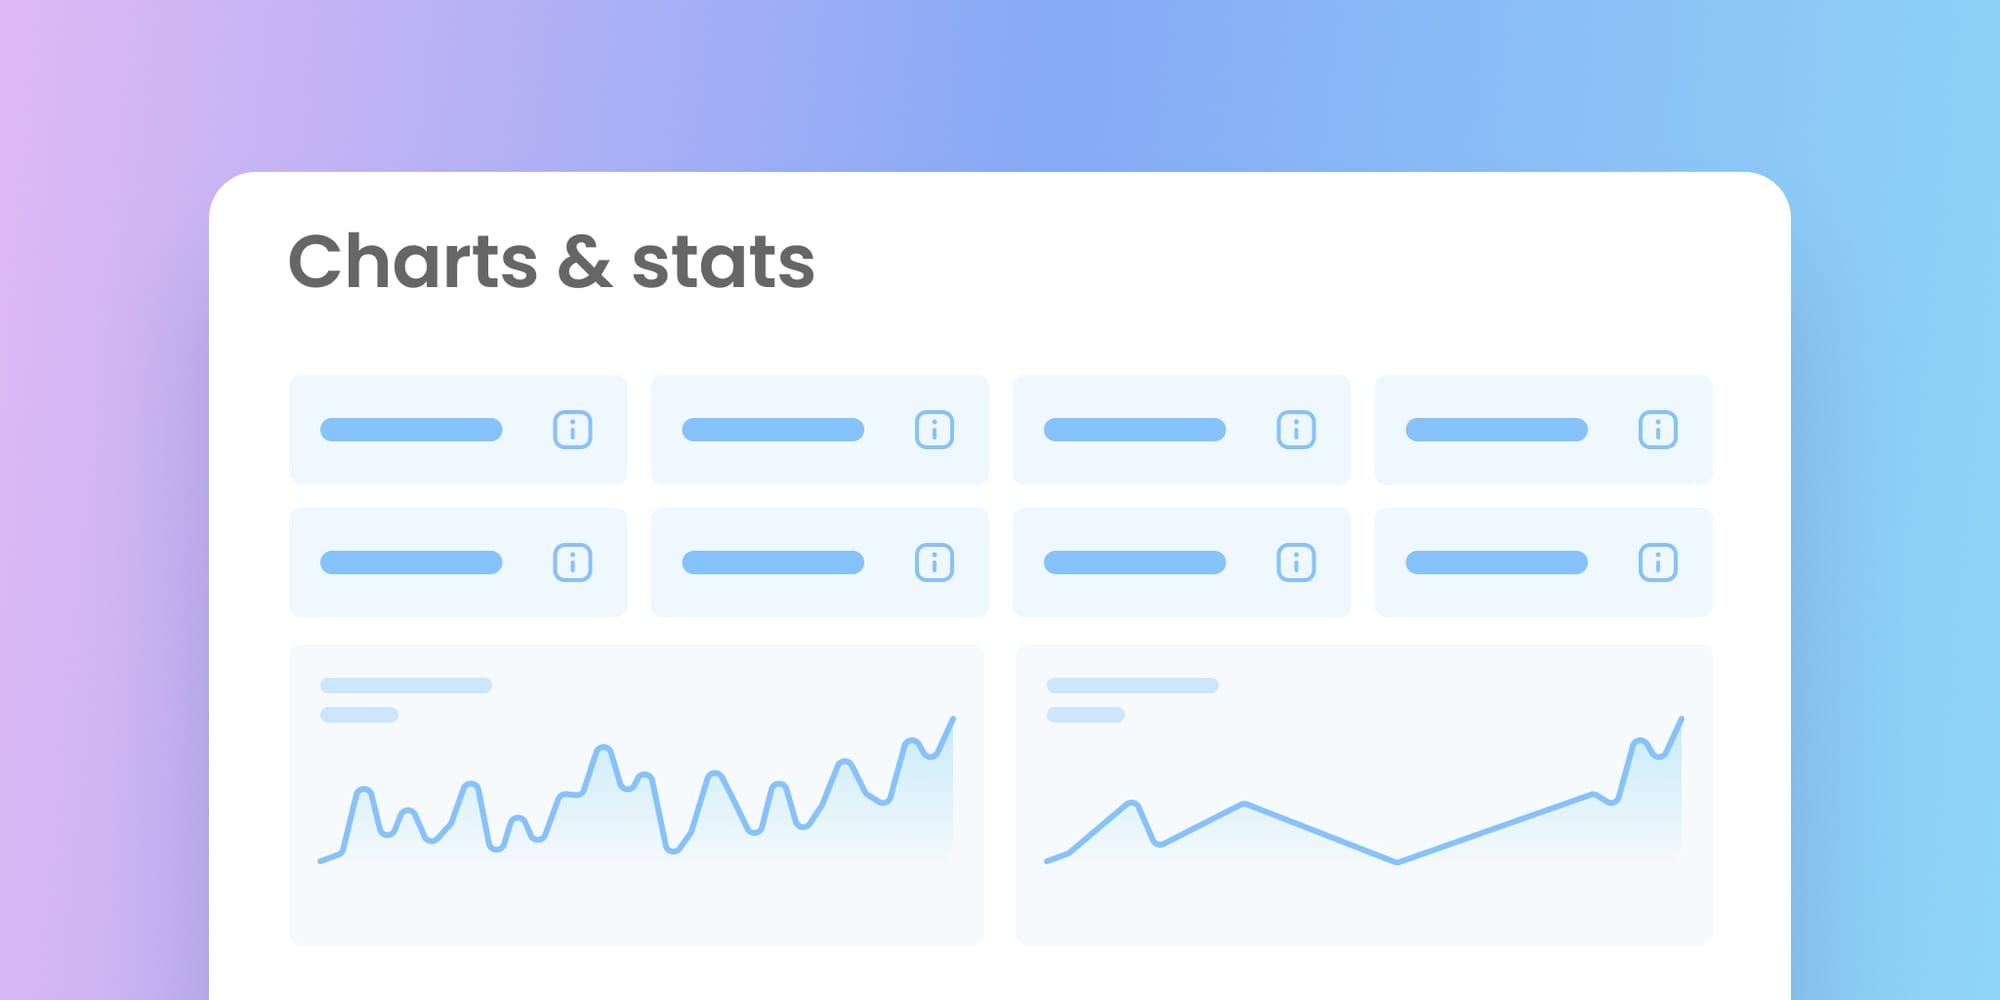
To access the Stats, go to your Explorer and click the “chart and stats” section on the sidebar.

The Stats dashboard provides an instant overview of the current metrics specific to the selected blockchain. Key metrics displayed include the total number of completed transactions, which reflects the total all-time volume of successful transactions, and the number of pending transactions, indicating transactions that have yet to be confirmed by the network.
Additionally, the dashboard also showcases metrics such as average transaction processing times, transaction fees, and the overall network congestion level, offering users a comprehensive view of the blockchain's performance and activity status.

Click the icon adjacent to each stat to reveal more information on the specific metric.
Stats Options
You can explore a variety of data statistics from your blockchain, each option offering insightful charts and detailed metrics that enhance your understanding and interpretation of the underlying information.
The timeframe tab offers you the flexibility to define the specific time range for the data you wish to visualize. By clicking on the dropdown button, you can select the particular statistics that interest you and also tailor the time settings to suit your preferences.

The “All stats” option displays the stats for all available data options. Let’s go over each one of them individually below.
Accounts

- Number of accounts - This shows the growth of accounts on Ethereum over time.
- Active accounts - This shows the number of active accounts over time; in this case, the chart displays the total number of active accounts.
- New accounts - This shows the volume of new accounts added to the network.
Transactions

- Average transaction fee - This illustrates the average amount of Ethereum (ETH) expended on gas fees for each transaction.
- New Transactions - This illustrates the frequency of new transactions occurring over a specified time period.
- Transaction fees - This illustrates the overall expenditure on gas over a specified period.
- Number of Transactions - This illustrates the growth in transactions over time.
- Transaction success rate - This illustrates the overall success rate for all transactions contained within the specified timeframe.
Blocks

- Average block rewards - This is the average amount validators receive for adding a block to the blockchain.
- Average block size - This is the average size of blocks on the blockchain.
- New blocks - This shows the number of new blocks added to the chain.
Tokens

This shows the number of completed token transfers over time.
Gas

- Average gas limit - This is the average amount of gas that can be used up by a single block.
- Average gas price - This shows the average cost in Gwei per gas unit per time.
- Total gas usage - This is the total gas used over time.
Contracts

- New verified contracts - This graph shows the number of newly verified contracts
- Number of verified contracts - This graph shows the cumulative growth of verified contracts over time, highlighting the increasing number of contracts that have undergone thorough verification processes.
View and Save Stats
You can view and share stats data by clicking on the option button.

Share
Share your data through a variety of sources
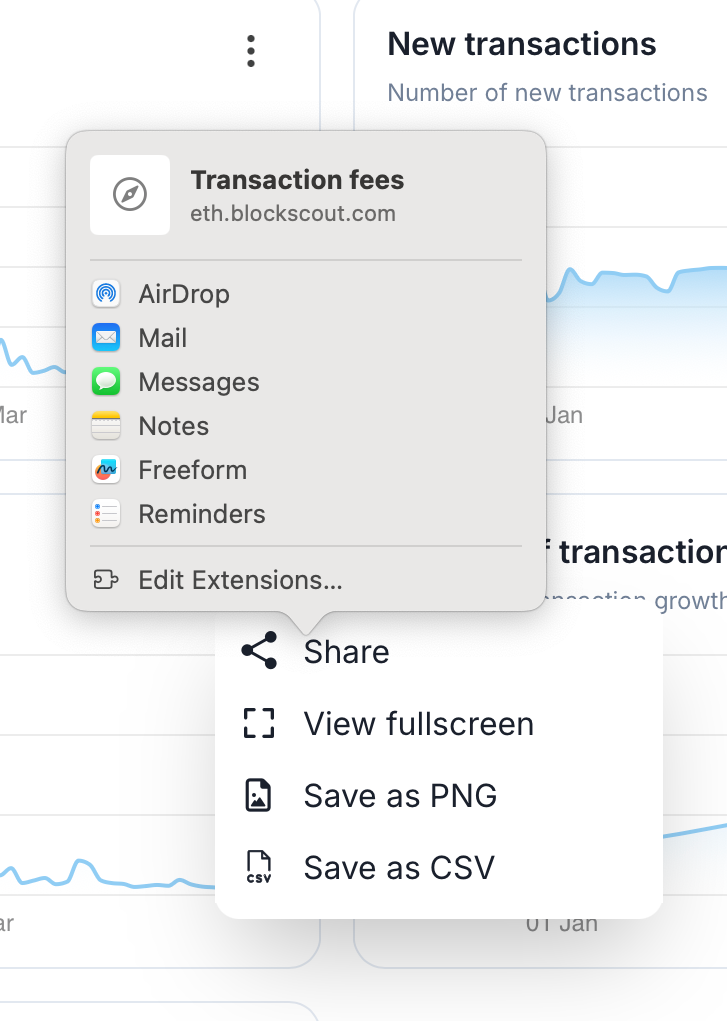
View in Fullscreen
Fullscreen mode allows you to visualize your data with more detail.
Click on the cancel button to return.

Save As PNG & CSV
This automatically downloads the stats to your systems directory

Example Using Blockscout Stats
Using Blockscout stats, we can generate a simple chart using chatGPT.
For this example, let’s compare the average transaction fee vs the average gas price for a 3-month period
Download the CSV files for the stats and ask ChatGPT to generate a chart comparing them.

Here’s the comparison of average transaction fees (blue) and average gas prices (orange) over a 3-month period. The trends show how changes in gas prices correlate with transaction fees.