
Build a Multichain Dashboard with Blockscout PRO API


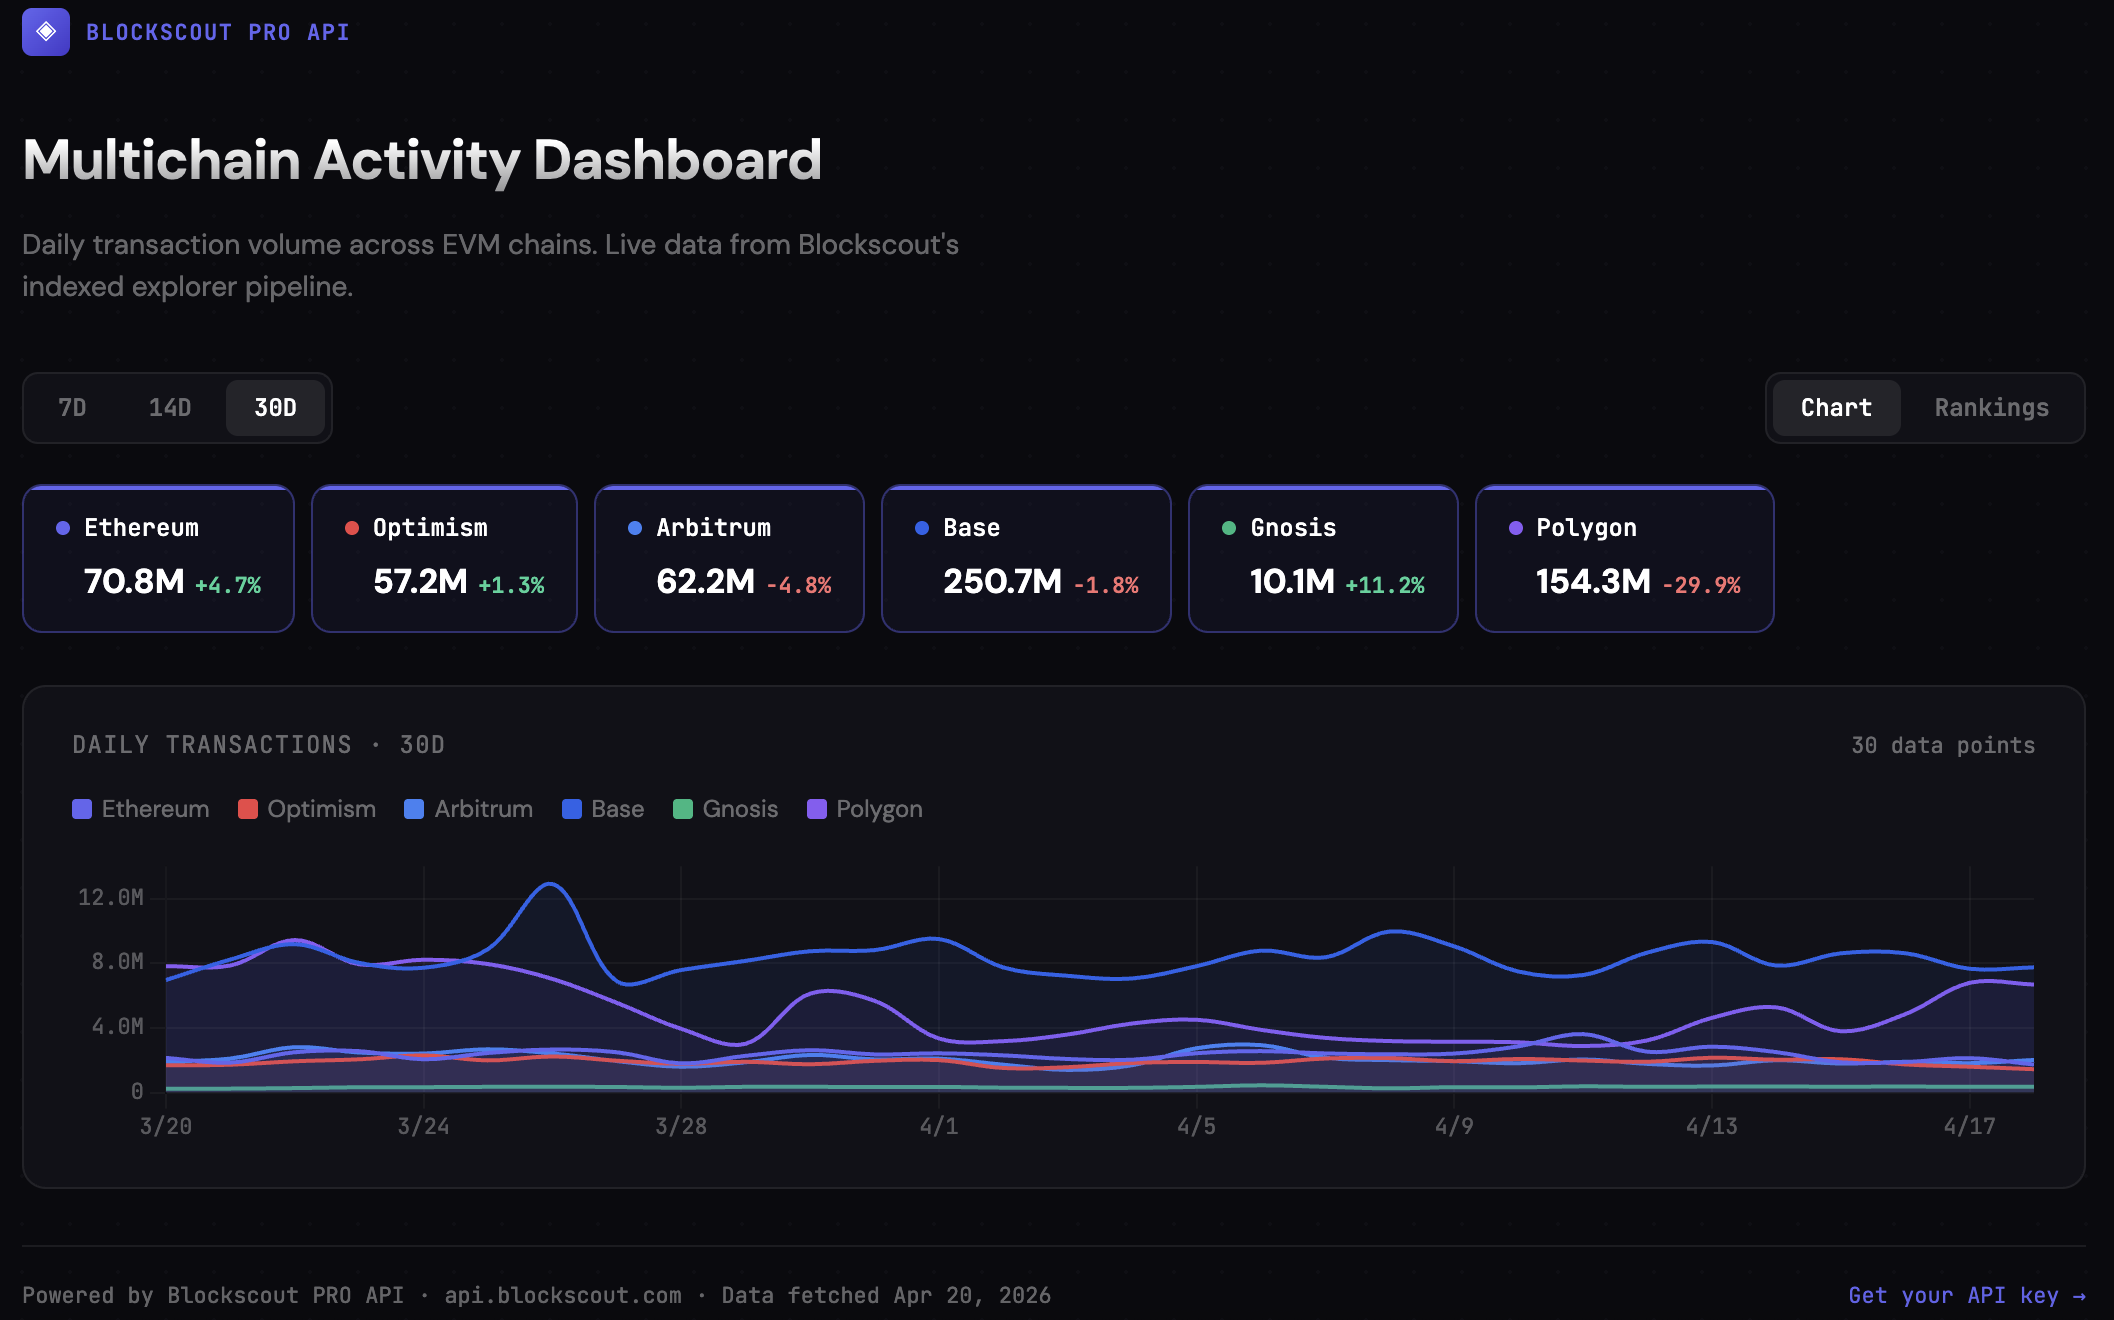
Create a dashboard like this (Standalone HTML dashboard) in minutes with Blockscout's PRO API! Follow the easy tutorial below to learn about multichain queries, available stats, data, and how to get it.
All you need is a free PRO API key to get started.
Blockscout PRO API gives you structured, explorer-level onchain data across 100+ EVM chains through a single API.
In this guide, we'll use it to build a simple multichain dashboard that answers a very practical question:
Where is onchain activity currently happening?
By the end, you'll have a working setup that shows daily transaction volume across chains like Ethereum, Optimism, and Gnosis over the last 30 days. Something you can actually use to guide decisions, not just look at.
O' Users, Where Art Thou?
If you support multiple chains, you'll probably run into this at some point.
You're live on Ethereum. Maybe you've expanded to Optimism, Arbitrum, or Base. You've added support, shipped the integrations, and everything technically works.
But when it comes to usage, things get blurry.
Where are users actually transacting? Which chains are growing organically? Which integrations are worth doubling down on?
You can try to answer this by jumping between explorers, or by stitching together raw RPC calls across networks. But that quickly turns into fragmented data and extra engineering work.
What you really need is a single view across chains. Something simple, reliable, and grounded in real onchain activity.
What We're Building
We're not building a full analytics platform, the goal here is to keep it simple and straightforward.
We'll create a lightweight dashboard that shows daily transaction activity across multiple chains, side by side. From there, you can compare trends, spot changes in usage, and start forming real hypotheses about where activity is moving.
At its core, the dashboard includes:
- Daily transactions per chain
- A simple comparison across networks
- The ability to extend into rankings or growth metrics
It's intentionally minimal. No backend infrastructure, no indexing pipeline, no data stitching. Just a few API calls and clean, ready-to-use data.
The Flow
The build process follows a straightforward sequence.
First, we fetch the list of supported chains. Then we resolve those chain IDs into something human-readable and filter down to mainnets. After that, we pull transaction data for each chain and render it however we like.
Step 1: Get Supported Chains
We'll query the PRO API to see which chains are available.
GET https://api.blockscout.com/api/json/config?apikey=YOUR_API_KEY
This returns the full list of supported chain IDs.
Instead of hardcoding networks, your dashboard can dynamically stay in sync with Blockscout's coverage. As new chains are added, they can be included automatically.
Step 2: Turn IDs into Real Chains
Raw chain IDs are not very useful on their own. To build something readable, we resolve them into metadata.
GET https://chains.blockscout.com/api/chains?chain_ids=1,10,100
This gives you names, logos, and context like whether a chain is a mainnet or testnet.
At this stage, you'll typically filter out testnets and keep only the networks that matter for your dashboard. It also lets you label your charts properly instead of displaying raw IDs.
Step 3: See What Stats Are Available
Before pulling data, it helps to check what's available for a given chain. The PRO API exposes general stats at:
GET https://api.blockscout.com/{chain_id}/api/v2/stats?apikey=YOUR_API_KEY
This returns high-level network stats including total blocks, total addresses, and daily transaction counts.
For time-series chart data, the key endpoint is:
GET https://api.blockscout.com/{chain_id}/api/v2/stats/charts/transactions?apikey=YOUR_API_KEY
This returns daily transaction counts over the last ~30 days, which is exactly what we need.
Step 4: Fetch the Data
Now we pull the actual chart data for each chain we want to include.
GET https://api.blockscout.com/1/api/v2/stats/charts/transactions?apikey=YOUR_API_KEY
The response looks like this:
{
  "chart_data": [
    {
      "date": "2026-04-19",
      "transactions_count": 1735946
    },
    {
      "date": "2026-04-18",
      "transactions_count": 2129755
    }
  ]
}
You run this query for each chain you want to include, substituting the chain_id in the URL path:
https://api.blockscout.com/1/api/v2/stats/charts/transactions?apikey=YOUR_API_KEY      # Ethereum
https://api.blockscout.com/10/api/v2/stats/charts/transactions?apikey=YOUR_API_KEY     # Optimism
https://api.blockscout.com/42161/api/v2/stats/charts/transactions?apikey=YOUR_API_KEY  # Arbitrum
https://api.blockscout.com/8453/api/v2/stats/charts/transactions?apikey=YOUR_API_KEY   # Base
https://api.blockscout.com/100/api/v2/stats/charts/transactions?apikey=YOUR_API_KEY    # Gnosis
https://api.blockscout.com/137/api/v2/stats/charts/transactions?apikey=YOUR_API_KEY    # Polygon
The response gives you clean, structured daily data. No decoding, no aggregation, no post-processing required. It's already in a format you can use directly in charts, tables, or exports.
Step 5: Turn It Into Something Useful
At this point, you already have everything you need.
Even a simple output like this is enough to start:
=== Ethereum ===
2026-04-18 | 2,129,755
2026-04-19 | 1,735,946

=== Optimism ===
2026-04-18 | 1,600,387
2026-04-19 | 1,446,762
From here, you can take it in a few directions.
You can export the data into a CSV and open it in Excel or Google Sheets. You can plug it into a charting library like Chart.js or Recharts to visualize trends. Or you can wire it into an internal dashboard your team checks regularly.
The important part is that the data is already usable.
A Note on CORS and Browser-Based Dashboards
If you're building a client-side dashboard that makes API calls directly from the browser (e.g., a React app, a static HTML page, or an embedded widget), you may run into CORS restrictions.
The Blockscout PRO API does not currently set permissive CORS headers for browser-origin requests. This means fetch() calls from a frontend app will fail silently or throw a cross-origin error, even with a valid API key.
The fix is straightforward. Route your API calls through a lightweight backend proxy or a serverless function (Cloudflare Workers, Vercel Edge Functions, AWS Lambda, etc.). Your proxy fetches from api.blockscout.com server-side and passes the response to your frontend.
Browser → Your proxy (e.g. /api/chain-stats) → api.blockscout.com → response
For local development, a simple Express or Fastify server works fine. For production, a serverless function adds zero infrastructure overhead.
This is a common pattern with any third-party API. It also gives you a natural place to add caching, which reduces your credit usage and speeds up page loads.
Alternatively, if you're building with tools that have server-side access (Node.js scripts, Python, cURL, MCP integrations, or CI pipelines), the API works without any CORS considerations.
What This Actually Lets You Do
Once you have this running, it becomes more than just a chart.
You can start comparing activity across chains in a way that's consistent and reliable. You can see whether usage is shifting toward certain networks, or whether activity is plateauing somewhere you expected growth.
It also helps answer practical questions:
- Should you prioritize deeper integration on a specific chain?
- Is a new ecosystem actually gaining traction, or just noise?
- Did a campaign or launch meaningfully impact activity?
Because you're working with structured, explorer-level data, the signals are much easier to trust.
Extending the Dashboard
The base version is intentionally simple, but it's easy to extend.
You can add rankings to identify the most active chains over the last 7 or 30 days. You can calculate growth rates to see which ecosystems are accelerating. You can layer in additional metrics like gas usage or fees to get a deeper view of activity.
You can also turn this into something operational. For example, setting alerts when activity spikes or drops, or generating weekly reports for your team.
None of this requires rethinking your architecture. You're just building on top of the same endpoints.
Why This Works Without Extra Infrastructure
Normally, building a multichain dashboard like this involves a lot more work.
You'd need to query multiple RPC endpoints, normalize responses, aggregate data, and maintain your own indexing layer. Each chain introduces its own complexity.
Here, you skip all of that.
You're querying indexed, decoded, and structured data directly from the same pipeline that powers Blockscout explorers. The data is already consistent across chains, which makes comparison straightforward.
Multichain by Default
This is where PRO API becomes especially useful.
Instead of managing separate APIs, credentials, and integrations for each network, you work with a single API key and a consistent interface across all supported chains.
That includes over 100 EVM networks, such as Ethereum, Optimism, Arbitrum, Base, and Gnosis, with more continuously added.
You integrate once, and your dashboard can expand as your multichain footprint grows.
API Authentication Reference
The PRO API supports two authentication methods:
Authorization header (useful for JSON-RPC and ETH RPC):
curl -H "authorization: Bearer proapi_xxxxxxxx" https://api.blockscout.com/1/json-rpc
Query parameter (recommended for REST calls):
https://api.blockscout.com/1/api/v2/stats/charts/transactions?apikey=proapi_xxxxxxxx
API keys follow the format proapi_xxxxxxxx and can be generated in the dev portal.
Try It: Live Dashboard
We've included a standalone HTML dashboard alongside this article that visualizes real transaction data pulled from the PRO API. It is not realtime data (due to CORS) but shows how a simple dashboard can be created. Check it out here.
- Daily transaction volume across Ethereum, Optimism, Arbitrum, Base, Gnosis, and Polygon
- Chain-level rankings with trend indicators
- Toggle between 7-day, 14-day, and 30-day views
- Click individual chains to isolate or compare
The dashboard ships with data baked in (fetched at publish time) so it works without an API key or backend proxy. To make it live-updating, connect it to the endpoints above through a server-side proxy.
Get Started
You can start building this in minutes.
Create an account in the Blockscout Dev Portal, generate your API key, and begin querying multichain data right away.